Influencer marketing ROI measurement 2026 refers to the process of quantifying the revenue, conversions, and incremental lift generated by creator campaigns. In 2026, best-practice measurement combines multi-touch attribution, view-through windows, and geo holdout incrementality tests to capture the full value of influencer touchpoints that last-click models routinely miss.
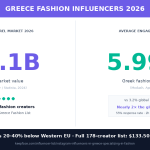
In 2026, the global influencer marketing industry is worth $34.1 billion and delivers an average of $5.78 for every $1 spent. Yet 73% of brands still admit they cannot correctly measure influencer ROI (Influencer Marketing Hub 2026). The brands closing that gap are reporting 20-35% ROAS improvements without adding a single dollar of budget. The problem is not the channel. It is the measurement model.
Run attribution-ready influencer campaigns on Keepface →
Table of Contents
- The $34 Billion Industry Still Flying Blind on ROI
- Why Last-Click Attribution Undercounts Influencer Impact
- View-Through and Multi-Touch Attribution: The New Standard
- Incrementality Testing: The Gold Standard for Influencer ROI
- Creator Tier ROI Benchmarks: Nano, Micro, Macro, and Mega
- How to Build a Measurement Stack Finance Will Accept
- How Keepface Helps Brands Measure What Actually Works
- Key Takeaways
- Frequently Asked Questions
The $34 Billion Industry Still Flying Blind on ROI
Quick answer: Influencer marketing is the highest-ROI digital channel on average, but broken attribution models mean most brands are dramatically underreporting its value and misallocating budgets as a result.
The gap is striking. Influencer marketing generates an average of $5.78 per $1 invested, with top campaigns reaching $18-20 per dollar (Sociallyin 2026). Yet 73% of brands say they cannot prove that return to a CFO. The disconnect comes down to measurement: brands are applying attribution models designed for paid search to a channel with a fundamentally different conversion path.
Influencer content works across the entire funnel. A viewer saves a TikTok, mentions the brand to a friend, searches it three days later, and converts via organic search. Last-click attribution gives all the credit to Google. The creator who started the journey gets zero. The brands winning on influencer marketing in 2026 are not spending more. They are measuring better, and that is changing where they put their money.
Why Last-Click Attribution Undercounts Influencer Impact
Quick answer: Last-click attribution misses 50-90% of influencer-driven conversions because it only captures the final action before purchase and ignores the discovery and consideration stages where creators do most of their work.
Most influencer-driven consumers do not click directly from a post to a product page. They see the content, leave, return through a different channel, and convert days later. Last-click models assign that sale to whichever touchpoint captured the final click, typically paid search or direct.
The data is stark. Last-click undercounts influencer-driven conversions by 50-90%, with the gap widening for products with longer consideration cycles (Influencers-Time 2026). In B2B-style purchase journeys, last-click attribution missed 80% of an influencer’s measurable impact (LayerFive 2026). Accuracy analysis confirms the scale of the problem: position-based multi-touch attribution achieves 67% accuracy versus only 42% accuracy for last-click models (Influencer Marketing Hub 2026). Despite this, 49% of brands were still relying on last-click as recently as 2024. That share has now fallen: 51% of brands used multi-touch attribution in 2026, up from 31% two years earlier.
View-Through and Multi-Touch Attribution: The New Standard
Quick answer: Multi-touch attribution distributes conversion credit across all touchpoints in the customer journey. Combined with the right view-through windows, it captures the full value of influencer exposure, including passive views that drive purchase without a direct click.
View-through attribution tracks conversions from users who saw influencer content but did not click through. The standard window settings in 2026 are 7-14 days for Instagram and TikTok content and 30 days for YouTube long-form, reflecting how long viewers take to return and convert after initial exposure (InfluenceFlow 2026).
There are three main multi-touch models in active use:
- Linear: equal credit across all touchpoints. Simple to implement but ignores the outsized role of first discovery.
- Time-decay: later touchpoints receive more credit. Works well for always-on campaigns where recent exposure drives action.
- Position-based (U-shaped): first and last touchpoints get the highest credit, middle interactions split the rest. Best fit for influencer awareness-to-conversion funnels.
The return on switching is concrete. Brands using multi-touch attribution report 25% higher ROAS compared to those still on last-click models (Syncly 2026).

Incrementality Testing: The Gold Standard for Influencer ROI
Quick answer: Incrementality testing measures how many sales would have happened without the influencer campaign. It is the most finance-credible method because it mirrors controlled experiment logic: exposed group versus control group over the same time window.
The standard approach is a geo holdout test run over 60-90 days. A defined geographic market sees the influencer campaign while a matched control market does not. Incremental ROAS is calculated as:
(Exposed Revenue – Control Revenue) / Campaign Cost
A lift above 20% over baseline is the threshold for confirming genuine incremental impact (InfluenceFlow 2026). Real-world results validate the method. Mondelez ran a matched-market test across 116 retail locations and recorded a $2.41 incremental ROAS alongside a 14% lift in in-store sales (InfluencerNexus 2026). The business case for incrementality investment is growing: 36.2% of marketers plan to increase their incrementality testing budgets in the next 12 months (eMarketer/TransUnion 2025). Critically, the payoff does not require more spend. Brands with mature attribution frameworks report 20-35% ROAS improvements from reallocating existing budgets based on incrementality data alone (Syncly 2026).
Start measuring influencer ROI correctly on Keepface →
Creator Tier ROI Benchmarks: Nano, Micro, Macro, and Mega
Quick answer: Smaller creators consistently deliver higher ROAS and lower cost per engagement than larger ones. 73% of brands now prefer micro and mid-tier creators for conversion-focused campaigns, with nano creators showing the strongest efficiency metrics in e-commerce contexts.
| Tier | Followers | ROAS (indicative) | Conversion Rate | Cost Per Engagement |
|---|---|---|---|---|
| Nano | 1K-10K | 6.2x | 4.2% | ~$0.12 |
| Micro | 10K-100K | 4.1x | 3.1% | ~$0.20 |
| Macro | 100K-1M | 1.8x | ~1.5% | ~$0.33 |
| Mega | 1M+ | ~1.2x | ~0.9% | ~$0.45+ |
Sources: Zeth.nl (ROAS — indicative e-commerce benchmarks, Dutch market), DigitalApplied 2026 (conversion rates), ATTN Agency (CPE). ROAS varies by category, region, and campaign objective.
The engagement premium compounds the cost advantage. Micro-influencers (10K-100K followers) average 3.86% engagement compared to 1.21% for mega-influencers with 1M+ followers, a 3.2x differential (DigitalApplied 2026). On TikTok specifically, nano creators reach approximately 18% engagement while mega creators average around 4%. Cost per acquisition reinforces the case: nano-influencer campaigns deliver an average CAC of $18.50 versus $22.75 for micro-influencer campaigns, both significantly below macro and mega tier benchmarks.
ROAS by Creator Tier (Indicative E-Commerce Benchmarks, 2026)
Nano
6.2x ROAS
Micro
4.1x ROAS
Macro
1.8x ROAS
Mega
~1.2x
Source: Zeth.nl e-commerce indicative benchmarks 2026. Results vary by category, market, and campaign setup.
This efficiency is why 73% of brands now prefer micro and mid-tier creators (Influencer Marketing Hub 2026) and 51.43% plan to expand their nano creator use in the next 12 months. The optimal strategy for most brands is a tiered mix: nano and micro for conversion efficiency, macro and mega for broad awareness reach.
How to Build a Measurement Stack Finance Will Accept
Quick answer: The most credible measurement framework combines three layers: Marketing Mix Modeling for strategic budget decisions, multi-touch attribution for campaign optimization, and incrementality testing to validate causality. No single method alone is sufficient for finance-grade reporting.
The three-layer framework in use at sophisticated brands in 2026:
- Marketing Mix Modeling (MMM): top-down statistical model showing which channels drive revenue at a macro level. Updated quarterly. Answers: should influencer be 10% or 20% of total budget?
- Multi-Touch Attribution (MTA): user-level journey tracking across all digital touchpoints. Optimized weekly. Answers: which creators, platforms, and content types are converting?
- Incrementality Testing: controlled geo holdout experiments run quarterly or per campaign. Validates causality. Answers: how much of this revenue would have happened without the campaign?
Running these three systems in coordination is the recognized best-practice standard (HouseOfMartech 2026). For brands starting from zero: implement view-through tracking and MTA first. The setup cost is lowest and the attribution gap closed is immediate. Add incrementality testing once you have six months of MTA baseline data to calibrate against.

How Keepface Helps Brands Measure What Actually Works
Quick answer: Keepface’s performance-based model and verified creator pool give brands a clean data foundation for attribution. Pay-per-outreach pricing aligns cost structure with measurable results, making incremental ROAS calculations straightforward.
Attribution accuracy starts with creator quality. Brands working with inauthentic audiences get distorted ROAS figures that lead to wrong budget decisions. Keepface’s network of 2,000,000+ verified creators, trusted by 6,000+ brands, is vetted for genuine audience quality, so your incrementality benchmarks and MTA models are built on real engagement signals rather than inflated follower counts.
The pay-per-outreach model directly maps to incrementality logic. Brands pay per campaign action, not per post published, making incremental ROAS calculations clean: there are no fixed fees to apportion when measuring revenue lift against campaign spend. For brands testing across tiers, Keepface’s creator pool spans every level from nano to mega, so you can run your own tier performance split tests against your own attribution data rather than relying on industry averages.
Key Takeaways
- The global influencer marketing industry reached $34.1 billion in 2026, with average ROI of $5.78 per $1 spent, yet 73% of brands cannot correctly attribute that return to justify budgets internally.
- Last-click attribution undercounts influencer-driven conversions by 50-90% because it assigns credit to the final touchpoint (typically search or direct) rather than the creator who initiated the journey.
- Switching from last-click to multi-touch attribution delivers an average 25% ROAS improvement with no change in campaign spend or creator mix.
- The standard view-through windows in 2026 are 7-14 days for Instagram and TikTok, 30 days for YouTube long-form content.
- Incrementality testing (geo holdout, 60-90 days) is the most finance-credible method. A lift above 20% over baseline confirms genuine causal impact. Mondelez achieved $2.41 incremental ROAS using this approach.
- Nano-influencers deliver indicative ROAS of 6.2x versus 1.8x for macro creators, with cost per engagement of $0.20 (micro) versus $0.33 (macro), a 65% efficiency gap.
- Brands with mature attribution frameworks improve ROAS by 20-35% through smarter budget reallocation, with no additional spend required.
- Keepface’s verified creators, pay-per-outreach pricing, and AI-powered matching give brands a clean attribution data foundation to measure what actually works.
Frequently Asked Questions
What is the best way to measure influencer marketing ROI in 2026?
The most accurate approach combines multi-touch attribution for day-to-day campaign optimization with geo holdout incrementality testing to validate causality. Multi-touch attribution using position-based or time-decay models captures the full conversion path with 67% accuracy, versus 42% for last-click. Pair this with quarterly incrementality tests to confirm campaigns are generating genuine lift above organic baseline. At the strategic level, add Marketing Mix Modeling to allocate channel budgets correctly. This three-layer system is now the recognized standard for finance-grade influencer measurement in 2026.
Why is last-click attribution bad for influencer marketing?
Last-click attribution only records the final touchpoint before a conversion, ignoring the discovery and consideration stages where influencer content does most of its work. Most viewers do not click directly from a creator post to a product page. They save content, recall it later, and convert through search or direct traffic. This means last-click systematically assigns influencer-driven revenue to other channels, understating influencer ROAS by 50-90% and distorting channel budget decisions. Brands that have corrected their attribution models consistently find influencer was performing far better than last-click data suggested.
How does incrementality testing work for influencer campaigns?
Incrementality testing runs a controlled experiment over a defined geographic or audience segment. One group is exposed to the influencer campaign while a matched control group is not. After 60-90 days, you compare revenue between exposed and control markets and calculate incremental ROAS as: (Exposed Revenue minus Control Revenue) divided by Campaign Cost. A lift above 20% over the control baseline confirms genuine incremental impact. This mirrors how finance teams think about causal proof and is far more defensible in budget reviews than attribution models alone, which cannot separate organic from paid-influenced conversions.
Which influencer tier delivers the best ROI: nano, micro, or macro?
Nano and micro creators consistently deliver stronger cost-efficiency metrics than macro and mega tiers. Nano-influencers generate indicative ROAS around 6.2x in e-commerce contexts versus 1.8x for macro creators, based on Dutch e-commerce benchmarks. Micro-influencers average 3.86% engagement versus 1.21% for mega creators, a 3.2x gap. Cost per engagement runs roughly $0.20 for micro versus $0.33 for macro. The right tier depends on campaign objective: nano and micro for conversion efficiency, macro and mega for rapid awareness reach. Most brands now run a tiered portfolio rather than committing entirely to one level.
What is view-through attribution and how long should the window be?
View-through attribution tracks conversions from users who were exposed to influencer content but did not click through directly. It captures the delayed purchase behavior that last-click misses entirely. Window length depends on content format and purchase cycle. For Instagram and TikTok short-form content, the standard window is 7-14 days, reflecting how quickly social audiences act on impulse-oriented content. For YouTube long-form content, the window extends to 30 days because viewers research and return over a longer period. Setting the right window is critical: too short and you miss real conversions; too long and you overcount content that was not the actual driver.
Conclusion
Influencer marketing ROI measurement in 2026 is not a problem of channel performance. The channel works. It is a problem of measurement infrastructure. Brands using multi-touch attribution and incrementality testing are recovering 25-35% of ROAS that was always there but never credited correctly. The shift from last-click to proper attribution does not require more budget. It requires better tooling, the right view-through window settings, and a creator pool with authentic engagement data that you can trust to produce clean attribution signals.
With 2,000,000+ verified creators, performance-based pricing, and AI-powered matching, Keepface is built for brands that want to measure what actually works. Start your first campaign today →